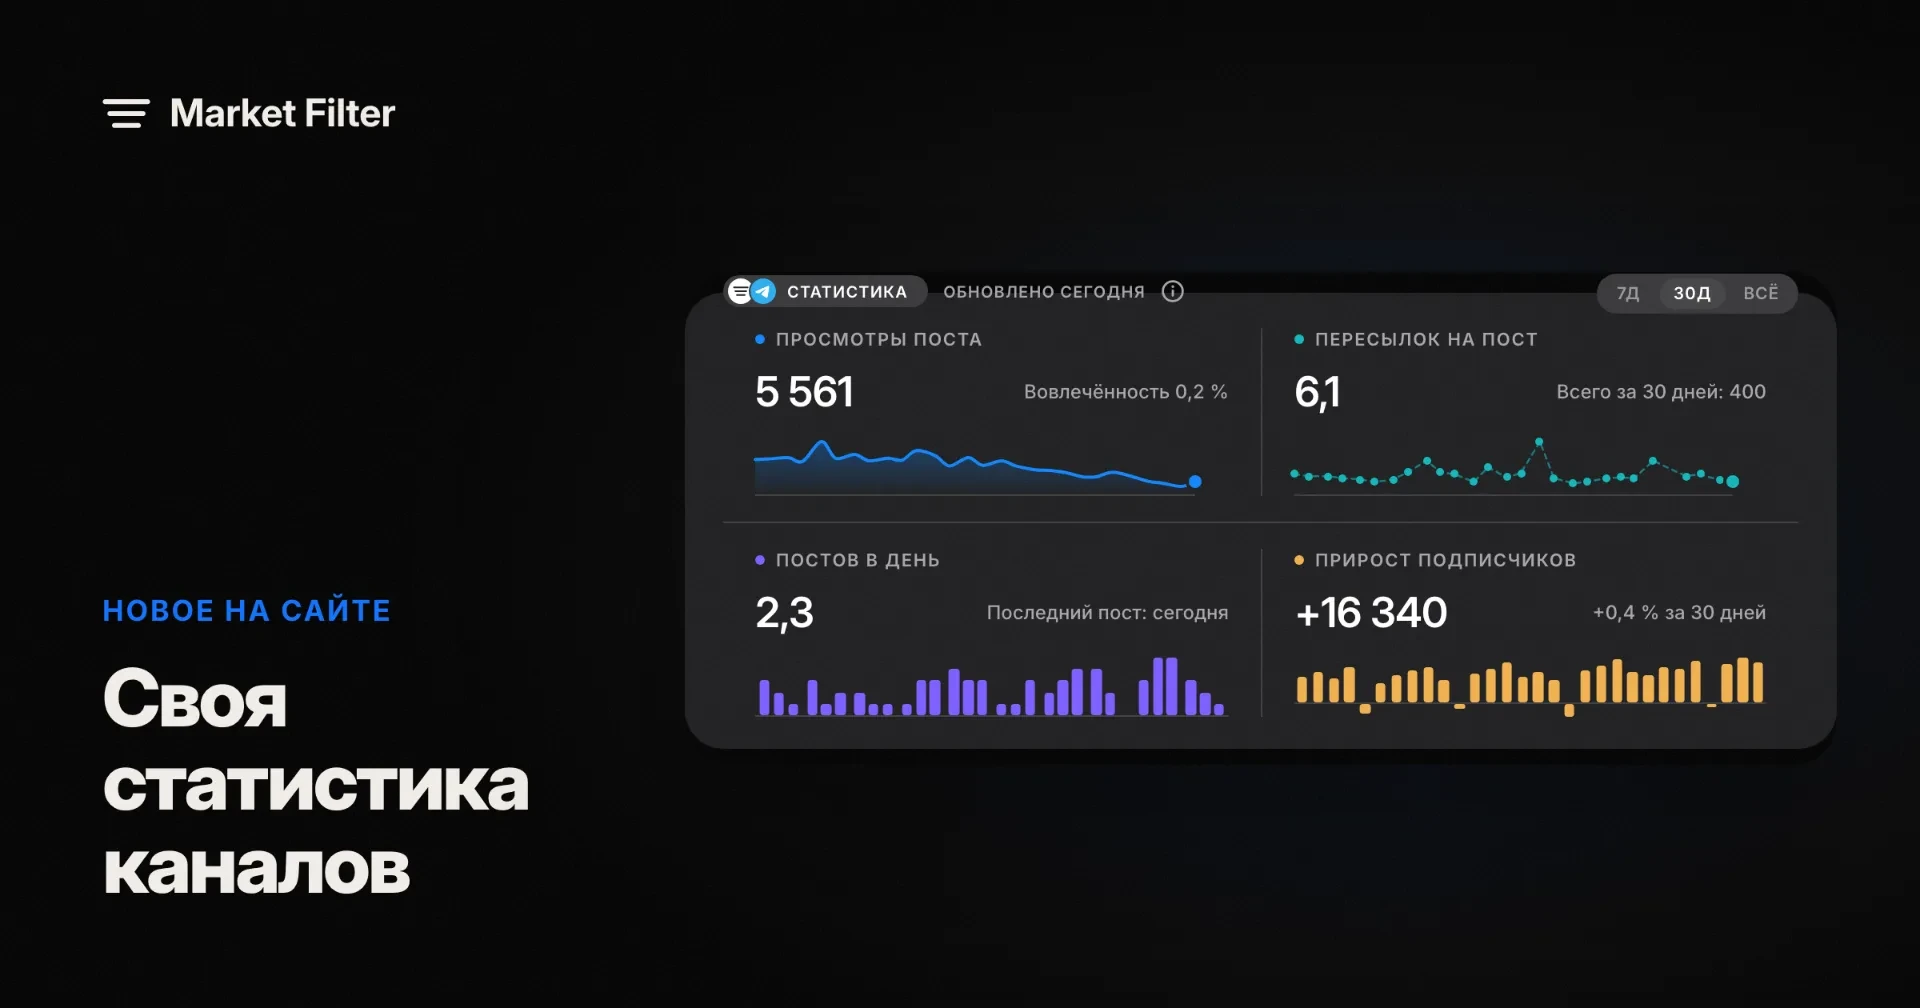
Market Filter statistics are now available on channel pages
Channel pages now show views, forwards, posting frequency and subscriber growth. Market Filter collects these metrics directly from publicly available Telegram data.
What has changed
Channel pages in the Market Filter directory now have a new “Statistics” section with four metrics, each with its own chart. Previously, these pages only showed an editorial rating and a description. You can now also see how active a channel is: how many views its posts receive, how often they are forwarded and how frequently new posts are published.
We collect all metrics ourselves. Once a day, we read publicly available Telegram data without using third-party services. This means the figures do not depend on other platforms, and we take responsibility for how they are calculated.
What the statistics show
All main metrics are calculated over the last 30 days.
Views per post is the median number of views: half of the posts receive more views, and half receive fewer. This calculation prevents a single viral post from distorting the overall picture. Posts less than three days old are excluded because they are still accumulating views. The engagement figure appears alongside this metric and is calculated by dividing the median number of views per post by the subscriber count.
Forwards per post is the average number of times a post is forwarded. The total number of forwards for the month is shown alongside it. This metric helps indicate how useful people find the content: they forward what they want to share.
Posts per day measures how frequently a channel publishes its own posts, excluding posts forwarded from other channels. An album containing several photos counts as one post. The time of the latest post is also shown, making it easier to see whether the channel is active or has been silent for a while.
Subscriber growth is the difference between the first and last measurements over 30 days. We have been collecting subscriber history since October 2. While there is not enough data, the section displays “Collecting history”. A full chart will be available here after a month.
Data, not an editorial rating
Which channels have statistics
The section is available for public channels in the directory. Private channels and groups do not have it because their data is not publicly available. Statistics are also not displayed for channels in the Market Scam section.
Data collection is being rolled out gradually, starting with the largest channels and then moving on to the rest. If a channel does not have the section yet, it will appear in the coming days.
Details of how each metric is calculated are available in the [methodology section].
Share article
Our Methodology
Every channel in the catalogue is checked by the editors against one method: it is how we work out the rating, place a channel at a risk level and decide whether it belongs in Market Scam.